The Making of Stansky's Monster
by
Ross M. Miller
Miller Risk Advisors
www.millerrisk.com
February 26, 2007
"Stansky's Monster" is my second paper based
on a simple idea: Most portfolios can be statistically decomposed into two
parts—one part that is easy to reproduce with "off-the-shelf"
parts and a second part that makes the investment distinctive. For mutual
funds and similar investment portfolios, the easy-to-reproduce part is
equivalent to an index fund (or the right combination of them) and the
leftovers are equivalent to a market-neutral hedge fund. ("Stansky's
Monster" is currently available at http://ssrn.com/abstract=964824
and the button to download it is at the bottom of that
page.)
I was not the first person to see this
relationship, but it does appear that I was the first to work out the
underlying math in a way that I could get some useful numbers out of it. I
derived a simple formula that converts the published R-squared of any
mutual fund into the share of its assets that are being
"actively" managed. For funds that closely track their benchmark
index, the active share of the fund will be quite low. For a hardcore
shadow indexer with an R-squared of 99%, is only really purchasing a bit
over 9% active management. Like any financial theory, there are some
assumptions that underlie the analysis, but the real test of the theory is
that the results it generates seem reasonable.
The first thing that I noticed was that if one looked at
the implied cost of active management, the typical active mutual fund was
much more expensive than it appeared and many hedge funds, especially
those with little or no index component in them, where cheaper than they
appeared. With some simple algebra, it was possible to reverse engineer
what the active part of a mutual fund cost by netting out the cost of the
passive part. The output of this research was an article entitled
"Measuring the True Cost of Active Management by Mutual Funds,"
which has led a fruitful existence as a working paper and will appear any
moment now in the First Quarter 2007 issue of the Journal
of Investment Management. (An electronic reprint of that article
is available here.)
It was not surprising to find that shadow index funds
are really quite expensive, charge someone even 50 basis points for a fund
that contains 9% active management and hedge funds, and implicit cost of
active management runs 5% and up. Viewed this way, the portable alpha
strategies used by many sophisticated institutional investors make sense
not only from a performance perspective, but also from a cost perspective.
While I was doing this research, I noticed something
else. There were a handful of shadow index funds that not only were
costing their investors a lot for what they were delivering, they were
consistently losing more money than could easily be accounted for in
management fees and related expenses. And it was not just obscure funds
that behaved this way. Fidelity Magellan Fund had an R-squared that
frequently exceeded 99% between 2002 and 2004 and yet managed to trail the
S&P 500 by nearly 3% per year over that timeframe. By my analysis,
Magellan is actively managing roughly 9% of the money it receives. Of that
9% at the very most 1% per year is being consumed by costs that are either
stated or hidden. (Magellan's expense ratio averaged around 70 basis
points during that period and its turnover averaged 13%, so even though it
may have overpaid its brokers in exchange for receiving freebies like
invitations to dwarf-tossing
parties, there is no way its legitimate expenses could have exceeded
1% in total.) This means that Magellan was losing a hefty chunk of the
funds (22% or more each year) that it was implicitly actively managing
even if one considers its expenses to be money down the rat hole.
The problem is that the typical way that people look at
mutual funds, which is encouraged by outfits like Morningstar and Lipper,
helps funds like Magellan hide what is really going on from its investors.
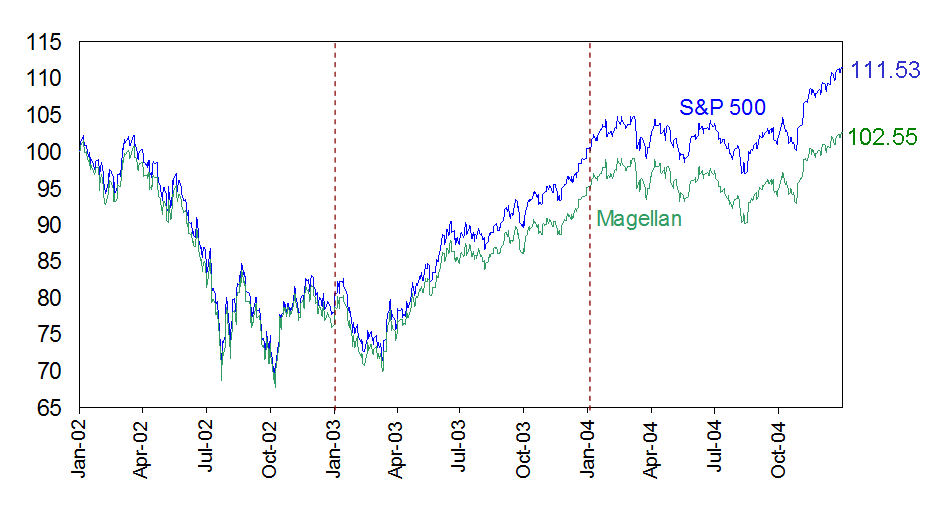
This is easily illustrated by two graphs. First, consider how Magellan did
relative to its benchmark, the S&P 500, between 2002 and 2004:

The nearly 9% shortfall is not good, but it is not that
awful either, at least not until we see what Magellan was doing with the
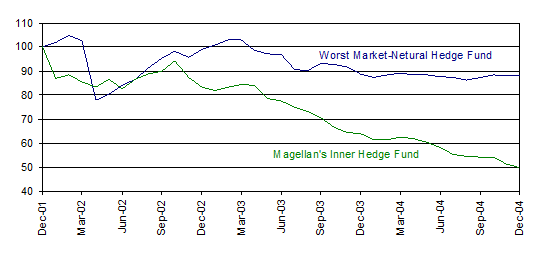
funds that it was actively managing. In that case, based on a formal
analysis that gives Magellan every benefit of the doubt, we get this
picture that shows the active part of Magellan dropping by over 50% while
the worst market-neutral hedge tracked by the University of Massachusetts
falls by only 12%:

"Stansky's Monster" presents my dogged effort
to figure out how Magellan's manager back then, Robert Stansky, could lose
so much money. (It also provides an explanation of how one gets from the
first graph to the second.)
Normally, data snooping (formerly known as "data
mining" until a positive spin was placed on that term) is a bad thing
in finance because it undermines the statistical significance of the
reported results. In the case of "Stansky's Monster" it only
reinforces the significance of the results because what I find is that
there is no legitimate (or even semi-legitimate) analysis of Magellan's
behavior that can explain where all the money went no matter how deeply I
dig.
In Fidelity's official filings with the SEC, Robert
Stansky claims that a combination of his industry and major stock
selections accounts for his shortfall. For the fiscal year ending March
31, 2004, I find that they explain essentially none of it. Indeed, anyone
with a Wal-Mart calculator and a passion for digging up numbers on the
Internet could spot the holes in Stansky's alibi. Things work out a little
better the following fiscal year that ends on March 31, 2005: Horrific
stock selections—Stansky had an amazing ability to invest in companies
that would become embroiled in scandal—do account for some, but not a
majority, of Magellan's risk-adjusted shortfall relative to the S&P
500, but the majority of it remains missing in action.
Overall, the missing money comes to well in excess of $2
billion at a time when the fund had about $60 billion in assets under
management. Unlike fictional mystery stories, there is no good answer to
where to the money went for now. For one thing, I do not have access to
Magellan's trading records—I have to get by with whatever I can squeeze
out of the net asset values that Magellan publishes each day and the
portfolios that it reports to the SEC, which presumably contain some
amount of window dressing. Furthermore, if Fidelity
"manipulated" Magellan's assets, those manipulations would
likely inject statistical noise into their net asset values and make the
job of squeezing information out of those numbers more difficult.
The explanation that I provide is that in the process of
doing the shadow indexing, Robert Stansky turned Magellan into a monster
that ultimately did in its creator by costing him his job.
If you want to find out the gory details, you will have to read the paper
for yourself. I get the feeling, however, that new theories will be
forthcoming in the days ahead. The full story of Stansky's Monster has yet
to be told.
Copyright 2007 by Miller Risk Advisors. Permission
granted to forward by electronic means and to excerpt or broadcast 250
words or less provided a citation is made to www.millerrisk.com.